NetSuite Subscription Metrics Setup: MRR, ARR & Cohorts
Executive Summary
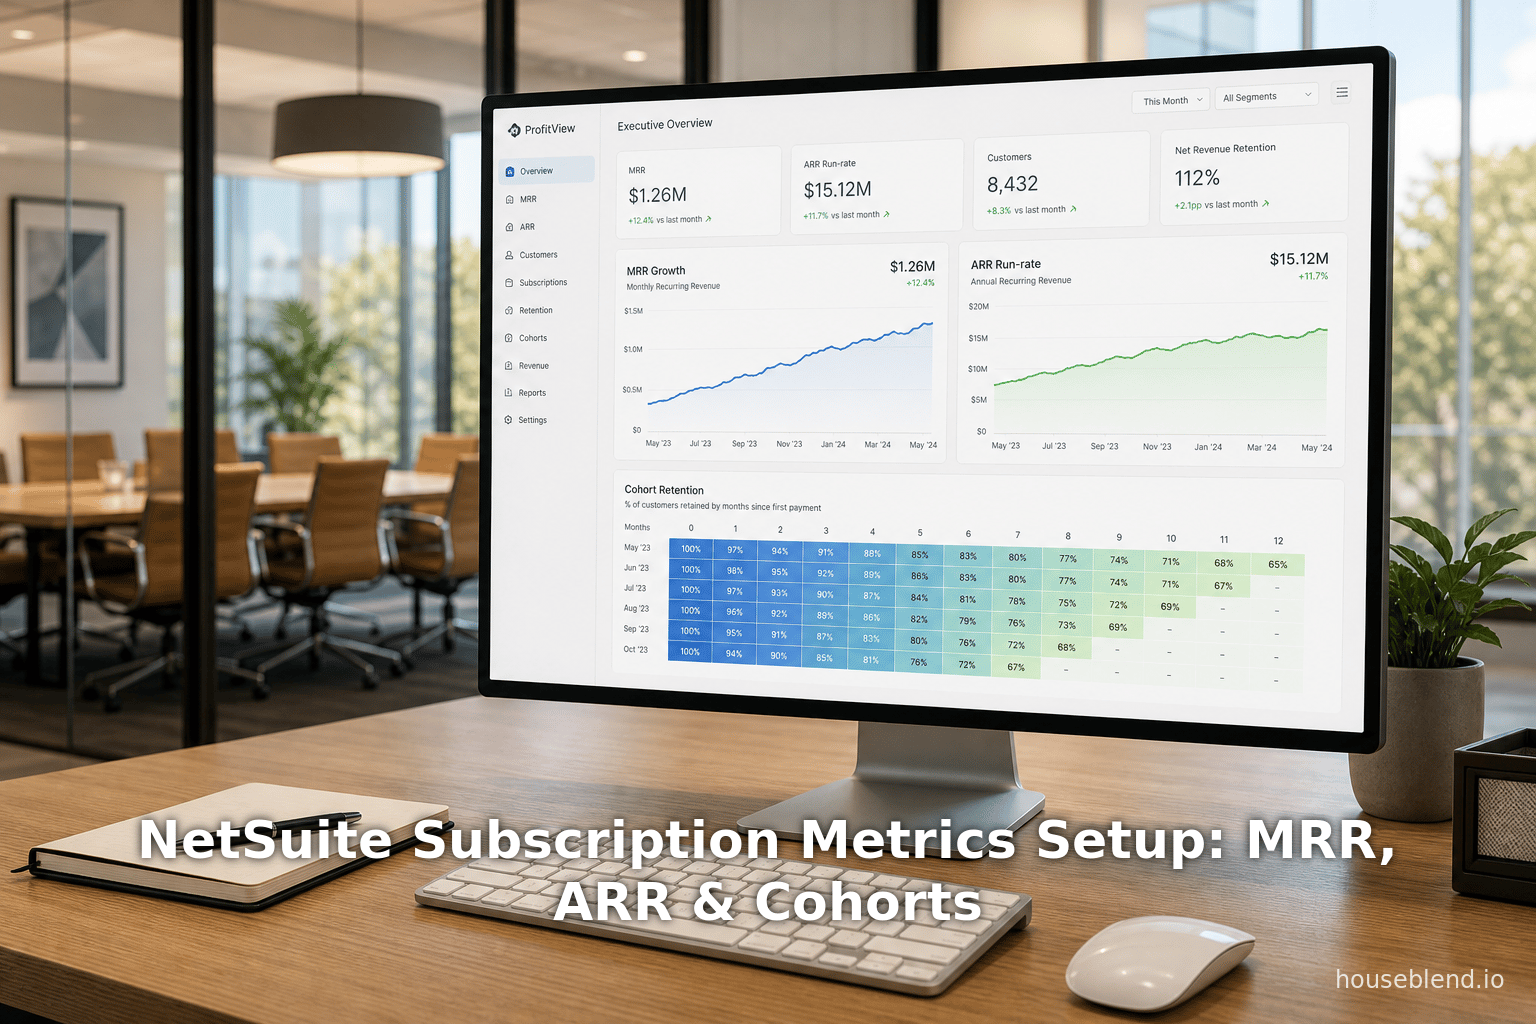
In the past decade, subscription-based business models have grown explosively across industries, driven by the recurring-revenue promise. Key performance indicators (KPIs) such as Monthly Recurring Revenue (MRR) and Annual Recurring Revenue (ARR) have become indispensable for managing Software-as-a-Service (SaaS) and other subscription businesses ([1]%20and%20reporting) [2]. To address the operational challenges of tracking these metrics across disparate systems, Oracle NetSuite launched the Subscription Metrics SuiteApp (2025.2+), a native analytics solution that unifies subscription, customer, and billing data to provide CFOs and CROs with real-time SaaS KPI dashboards and AI-driven insights [3] [4]. The SuiteApp automatically processes transactions (sales orders, renewals, invoices, etc.) into standardized SaaS metric impacts overnight, enabling live reporting on MRR/ARR growth, churn, retention, customer cohorts and unit economics [5] [6]. It includes Revenue Metrics, Retention Metrics, and Unit Economics dashboards, which cover top-line recurring revenues, renewal and churn patterns (including cohort analysis heatmaps), and efficiency metrics like CAC payback and LTV [6] ([7]%20customers). These tools remedy the “complexity” of manually consolidating subscription data across systems [8], giving finance leaders a unified view of performance.
This report provides an in-depth analysis of NetSuite’s Subscription Metrics offering. We first review the historical context: the rise of the subscription economy, the importance of standard SaaS metrics (MRR, ARR, NRR, churn, LTV, etc.), and cohort analysis for understanding customer retention. We then detail the NetSuite Subscription Metrics SuiteApp itself: its prerequisites, setup steps, and key features (with extensive citations from NetSuite documentation and press releases). Using vendor and industry sources, we examine how the SuiteApp computes MRR/ARR (leveraging NetSuite’s SaaS Metric Reporting feature) and supports cohort analysis. We include relevant tables (e.g. defining core metrics and summarizing SuiteApp features) and data-driven arguments. Case studies highlight implementation lessons (for example, how firms like Emburse and Halo Collar transformed billing and reporting) and multiple vendor perspectives (including NetSuite’s own marketing, consultant blogs, and complementary SuiteApps). Finally, we discuss broader implications and future directions, such as AI-powered analytics (NetSuite positions itself as an “ AI Cloud ERP” [3]), currency conversion for global SaaS (OneWorld constant-currency support [9]), and the evolving demands of subscription-focused finance teams. Our conclusion synthesizes insights on how NetSuite’s Subscription Metrics SuiteApp addresses the critical need for unified recurring-revenue visibility in modern enterprises.
Introduction and Background
Subscription and recurring-revenue business models have reshaped the modern economy. By 2025, nearly half of public companies had adopted some form of subscription model [10], driven by the promise of revenue predictability and customer lifetime value. A recent finance study shows that firms citing subscription models in SEC filings rose from 20.7% in 2002 to 48.7% in 2023, highlighting how pervasive this paradigm has become [10]. Managers increasingly emphasize subscription metrics as essential for cash flow forecasting, investor communications, and operational planning. As Hagerty notes, companies value subscription models for “revenue predictability” and “customer stickiness,” and such models even function as a form of corporate financing by creating a customer-funded “float” of recurring payments [10]. In short, in a global market where SaaS and high-tech startups proliferate, recurring revenue is king, and finance teams demand real-time intelligence on these KPIs.
By definition, the bedrock of subscription financial analysis is recurring revenue itself. MRR (Monthly Recurring Revenue) is the total of all subscription-derived revenues in a given month, normalized to a monthly basis [2]. ARR (Annual Recurring Revenue) is simply MRR annualized (roughly 12×MRR for steady monthly billing) and is the “top-line metric” for subscription firms [11] [2]. As Oracle’s official documentation emphasizes, “recurring revenue, either MRR or ARR, is the basis” of SaaS metrics and “used to determine the health of a business” [12]. In practice, these metrics drive every aspect of subscription finance: growth trajectories, churn analysis, and valuation forecasts. Other key metrics include Net Revenue Retention (NRR), Customer Lifetime Value (CLV/LTV), Customer Acquisition Cost (CAC) and its payback period, and churn rates (both revenue churn and logo churn). Table 1 below defines the core subscription metrics commonly used (with formulas and citations).
| Metric | Definition | Formula / Calculation |
|---|---|---|
| MRR (Monthly Recurring Revenue) | Total predictable revenue generated in a given month from active subscriptions [2]. It excludes one-time or usage-based fees. | Sum over all active subscriptions of (monthly contract value × quantity) [2]. |
| ARR (Annual Recurring Revenue) | The normalized value of subscription revenue on an annual basis; often simply MRR × 12 [11]. Represents the baseline annual revenue from active contracts. | ARR = MRR × 12 [11] (assuming steady monthly billing; other approaches annualize each contract’s revenue). |
| Net New MRR | The net change in MRR over a period, accounting for growth and contractions [13]. Indicates expansion or shrinkage in the recurring base. | Net New MRR = New MRR + Expansion MRR + Reactivation MRR – Contraction MRR – Churned MRR [13]. |
| Customer Churn Rate | Percentage of customers who cancel (logos lost) during a period [14]. High logo churn typically signals risk to future revenue. | Logo Churn % = (Customers Lost during Period) / (Customers at Start of Period) [14]. |
| Revenue Churn Rate | Percentage of recurring revenue lost from cancellations and downgrades in a period [14]. Unlike logo churn, it weighs larger accounts more heavily. | Revenue Churn % = (MRR Lost in Period) / (MRR at Start of Period) [14]. |
| Net Revenue Retention (NRR) | Total revenue retained from existing customers, including expansions [15]. NRR >100% (positive growth from existing base) is a sign of healthy upsells. | NRR = (MRR at End from existing base + Expansion MRR) / (MRR at Start) (often expressed as a percentage) [15]. |
| CAC (Customer Acquisition Cost) | Total sales & marketing cost to acquire a new customer [16]. Indicates how efficiently a company is adding customers; lower is typically better. | CAC = (Total Sales & Marketing Spend) / (New Customers Acquired) [16]. |
| CAC Payback Period | Time (usually months) to recover the CAC via gross margin on subscription revenue [17]. Reflects how quickly the acquisition spend pays off. | CAC Payback (months) = CAC / (ARPU × Gross Margin %) [17] (where ARPU = MRR / # customers). |
| LTV (Customer Lifetime Value) | Predicted net present value of revenue from a customer over its lifetime. Can be based on gross or net revenue retention. | Often calculated as (ARPU × Gross Margin %) / Churn Rate, but NetSuite’s SuiteApp offers “Customer Lifetime Revenue” and “Customer Lifetime Value” cohort metrics [18] [19]. |
| Cohort Analysis | A method of grouping customers by start-date (or other event) and tracking their retention/revenue over time [19]. Reveals aging/decay of customer groups. | No single formula; typically visualized as a heatmap where each row is a cohort of customers who joined in month ‘0’, and columns show metrics (count, churn, MRR, etc.) at N months after inception [6] [19]. |
Table 1: Key Subscription/SaaS Metrics Definitions and Formulas (sources cited) [2] [11] [14] [19].
In addition to these metrics, cohort analysis is a fundamental tool for subscription businesses [19] [6]. Cohorts group customers by a common start or signup period, allowing comparison of retention, churn, MRR, and LTV across vintages [19]. For example, one might track how the MRR of customers who started in January 2025 behaves in subsequent months versus those who started in June 2025. NetSuite’s SuiteApp offers built-in cohort analysis heatmaps (for metrics like “Number of Logos,” “Gross Logo Churn,” “Net Revenue Retention,” “Cumulative Lifetime Revenue,” etc.) [20] [21]. By visualizing these trends, companies can spot early survivor biases or declines and tailor their sales and retention strategies accordingly [6] [19].
Despite the recognized importance of these metrics, many companies struggle to aggregate subscription data from billing systems, CRM, and ERPs. As NetSuite consultants observe, “subscription data sits in one place, invoices in another, and renewals in a third,” making manual MRR/ARR reporting costly and error-prone [8]. This complexity has motivated vendors to create solutions that unify billing, revenue recognition, and analytics. Within the Oracle/NetSuite ecosystem, the evolution has been: (1) SuiteBilling (introduced in the early 2020s) to handle complex contract and usage billing; and (2) the new Subscription Metrics SuiteApp and SaaS Metric Reporting (2025.2+) to automate KPI tracking and reporting. Together, these tools transform NetSuite from a traditional ERP into a full-stack subscription management solution.
NetSuite (an Oracle company) is already widely used in SaaS: for example, 77% of the Forbes Cloud 100 companies rely on NetSuite to scale their operations [22]. To meet the analytics needs of these customers, NetSuite unveiled Subscription Metrics in October 2025 [3]. According to Oracle press releases, this out-of-the-box solution “brings together customer, subscription, and revenue history and forecasting in a single view”, providing CFOs and CROs with “industry-standard SaaS-company metrics, intuitive visualizations, and actionable AI-driven insights” [3]. It is available at no extra cost to existing NetSuite subscribers (with the appropriate edition/features) [23].
The remainder of this report dissects this suite of tools in detail. We draw on official NetSuite documentation, Oracle/press announcements, third-party analyses, and real-world examples to paint a comprehensive picture: how to set up and use the SuiteApp; how it calculates MRR/ARR and other KPIs; how cohort analysis is implemented; and how it complements or competes with alternative solutions. Each claim is supported by credible sources as cited.
Subscription Metrics in NetSuite: Overview and Features
The NetSuite Subscription Metrics SuiteApp is explicitly designed for subscription-based businesses that use NetSuite ERP. It leverages NetSuite’s underlying data (customers, sales orders, renewals, etc.) to compute a standard set of recurring-revenue analytics. According to NetSuite’s documentation, “The Subscription Metrics SuiteApp helps you track key metrics such as annual recurring revenue (ARR), monthly recurring revenue (MRR), churn, retention, and bookings in NetSuite” [24]. The SuiteApp provides interactive dashboards and reports so finance and operations leaders can analyze these KPIs in real time [24] [25].
Key Features
The SuiteApp includes three main dashboard modules (Revenue Metrics, Retention Metrics, and Unit Economics) plus out-of-the-box reporting elements. Its core capabilities, as described in Oracle/NetSuite literature, are summarized below:
-
Subscription Metrics and SaaS Dashboard: The tool natively tracks fundamental SaaS KPIs like MRR/ARR growth, churn, net retention, customer LTV, total contract value (TCV), CAC, and CAC payback [21]. An “out-of-the-box” landing page consolidates these into a unified view (with graphical tiles like MRR by month, ARR run-rate, NRR, etc.) [26] [2]. For example, the rollout notes that it shows “key measures like MRR/ARR Growth, LTV, TCV, NRR, CAC Payback, and MRR/CMRR” [21]. It also provides a drillable MRR/ARR roll-forward report, letting users see how their recurring revenue evolves from one period to the next (additions, expansions, contractions, churn) [27].
-
Roll-forward Reporting: Building on the dashboard, the SuiteApp produces detailed roll-forward waterfall analyses of recurring revenue [28]. In practice, this means finance teams can trace how net new MRR/ARR is generated: distinguishing new bookings vs. expansions vs. contractions vs. churned accounts. The SuiteApp did this historically via manual data prep, but with SaaS Metric Reporting it’s now automated. NetSuite highlights that users can “see what is driving growth or decline” by tracking how revenue changes over time [28]. In reports, one will typically find line-items or charts showing new subscriptions, upsells, downgrades, and cancellations as separate impacts on MRR/ARR.
-
Cohort Analysis (Retention Module): Perhaps most distinctive is the built-in cohort analysis heatmap [20] [28]. The Retention Metrics dashboard features heatmaps that compare groups of customers by their join month (cohorts) and track metrics like logo count, churn rates, retention rates, and revenues over each subsequent month. For instance, a cohort of customers who started in January 2025 will appear as row “Month 0 = Jan ’25,” “Month 1 = Feb ’25,” etc., colored by retention or churn percentage. The SuiteApp’s documentation notes that it supports a variety of cohort types, including Logo Count, Gross Logo Churn Rate, Logo Retention Rate, Revenue Churn/Retention (monthly and compared to baseline), and Lifetime Revenue/Value [20]. These heatmaps make it easy to spot whether newer cohorts retain better than older ones, an insight often linked to product improvements or market changes [19] [6].
-
Filtering and Segmentation: The dashboards offer extensive filtering: users can slice KPIs by Customer, Department, Class, Location, Item, and — in OneWorld accounts — by subsidiary [29] [9]. This multi-dimensional filtering allows, for example, analyzing MRR growth in North American customers or retention by product line. Constant-currency support is built-in: oneWorld customers can view global metrics standardized in a base currency [9].
-
Unit Economics Dashboard: A third dashboard focuses on profitability and efficiency. Here you can find the story behind the growth: metrics like CAC Payback (months to recover acquisition cost), LTV by cohort, gross margin formulas, and the Rule of 40 (growth rate plus profit margin) are surfaced. While not all of these are core to MRR/ARR, they are crucial for investment-worthy SaaS businesses. (Third-party SuiteApps also advertise these; AppWrap’s dashboard, for instance, explicitly includes rule of 40, net retention, and gross retention [30].)
-
AI-Driven Insights: Uniquely, Oracle markets this SuiteApp as embedding AI capabilities. It touts AI-generated narrative summaries and an AI Connector, whereby a CFO or data analyst can tie the subscription metrics data to an AI model of choice to ask natural-language questions or build bespoke forecasts [31]. While the current SuiteApp release primarily delivers the dashboards and static visual analysis, announcements promise that AI narration (explaining charts in plain language) will roll out within the next 12 months [25] [31]. This aligns with NetSuite’s broader positioning as the “#1 AI Cloud ERP” [3].
Table 2 below summarizes the key features of the Subscription Metrics SuiteApp as highlighted by NetSuite/Oracle sources.
| SuiteApp Feature | Description / Benefit |
|---|---|
| Core Subscription Metrics | Tracks fundamental SaaS KPIs out-of-the-box: MRR/ARR growth, new bookings, expansions, churn, LTV, TCV (total contract value), NRR, CAC and CAC Payback, etc. Provides real-time values of these measures [21] [32]. |
| Unified SaaS Dashboard | An integrated landing page aggregates key charts and KPIs in one view, with drill-downs. Includes an MRR/ARR roll-forward report, and combined graphics of acquisition vs. retention KPIs [27] [5]. |
| Retention Metrics & Cohorts | Delivers customer-retention analytics: churn rates, renewal histograms, and cohort heatmaps that compare customer or revenue retention across signup cohorts [6] [20]. Highlights trends in retention and LTV by cohort. |
| Unit Economics Dashboard | Computes efficiency metrics: CAC Payback, LTV per acquisition, gross margin contributions, and growth vs. profit (Rule of 40). Helps assess whether growth is sustainable and identify cost drivers of profitability. |
| Global & Segment Filters | Supports subsidiary-based filtering (OneWorld) and dimensions like Customer, Department, Class, Location, Item [9]. Multi-currency (constant currency) reporting standardizes global performance. |
| Historical Data Capture | Incorporates all historical transactions and subscriptions, any accounting period or contract type [9]. SuiteApp can also import legacy data via CSV to seed the analytics [33]. Ensures complete views of past performance. |
| AI Tools and Narratives | Integrates with NetSuite AI connector for custom analyses and offers AI-generated narrative summaries of charts [31]. Intended to translate complex metrics into board-ready insights (coming soon [23]). |
Table 2: Capabilities of the NetSuite Subscription Metrics SuiteApp (feature descriptions sourced from Oracle/NetSuite announcements and documentation) [21] [32] [6].
In summary, the Subscription Metrics SuiteApp provides a comprehensive, unified analytics platform for SaaS metrics. It automates what used to require manual ETL and spreadsheet crunching, aligning with best practices that stress timely, accurate KPI reporting. For example, NetSuite guidance recommends enabling metrics only on the needed item records (“in small batches” if there are many items) to ensure performance, and defines accounting periods for accurate ARR/MRR aggregation [34]. The result is a real-time, drillable KPI engine inside NetSuite, replacing ad-hoc revenue trackers.
Architecture and Setup
Prerequisites and Installation
To use the Subscription Metrics SuiteApp, a NetSuite account must meet key prerequisites. According to Oracle, the SuiteApp requires NetSuite 2025.2 or later and a OneWorld account structure [35] [36]. You must also enable the new Subscription Metric Reporting and Advanced Billing features in Setup ▶ Company ▶ Enable Features. Finally, if you operate in multiple currencies, you should enable NetSuite’s Multi-Currency and Currency Exchange Rate Type features [35] [9]. These settings ensure that transactions (order capture, invoices, renewals) will generate the necessary data records.
Once prerequisites are met, installation is straightforward: navigate to SuiteApp Marketplace, search for “Subscription Metrics”, and click Install [37]. After installation, administrators must assign the Subscription Metrics permission to relevant roles so users can view the dashboards [38]. NetSuite provides an installation guide, which outlines post-install tasks like configuring item records (see next section) and verifying role permissions [34] [39].
Configuring Subscription Items
A critical step is to configure your subscription products/services so that NetSuite knows how to recognize recurring revenue. On each Item or Service Item record that represents a subscription, you must mark it as active in subscription metrics tracking and define a SaaS Metric Start Date and, if applicable, an end date [34]. This tells the SuiteApp when that item’s revenue should begin (and stop) contributing to MRR. Typically, this aligns with the customer’s start-of-contract date. For example, if you sell an annual plan on July 1, you might set the SaaS start date to July 1 so that $X of MRR begins counting from that date forward. It is recommended to do this in manageable batches if you have many products, to avoid overloading the system [34].
NetSuite’s SaaS Metric Reporting feature (a prerequisite) will then capture events like new sales orders, renewals, or cancellations and automatically create metric-impact records. These records feed directly into the Subscription Metrics SuiteApp. Importantly, if historical transactions predate your implementation, you can import historical data via CSV so that past MRR/ARR is included [33]. This ensures a complete view even if you start using the SuiteApp midstream.
Data Consolidation and Processing
At the heart of the SuiteApp is data consolidation. Once configured, NetSuite’s background processes (typically nightly batches) scan all relevant transactions (subscriptions, invoices, cash sales, returns/refunds, etc.) and compute Analytical Impact and SaaS Metric records [40]. Each such record has an impact category and amount (e.g. “New ARR,” “Expansion MRR,” “Churn MRR,” etc.), capturing precisely how that transaction altered recurring revenue. By design, this is automatic and ongoing – the SuiteApp continuously reconciles live activity into metrics.
NetSuite states: “SaaS Metric Reporting consolidates your recurring revenue data into a single, comprehensive view. It pulls information from multiple transaction sources and standardizes it, delivering consistent MRR and ARR metrics across your NetSuite environment” [5]. The algorithms also allow manual overrides: an administrator can recategorize an impact if, say, a split-proration or a rare contract nuance requires it [41]. But by default, “no manual recalculation” is needed – edits to the underlying data flow through. The resulting metrics (stored internally) are accessible to SuiteAnalytics, the Analytics Warehouse, and the Subscription Metrics dashboards [33]. In effect, the SuiteApp provides real-time ELT (Extract-Load-Transform) of subscription data, eliminating the common Excel bottleneck in subscription accounting [8].
Dashboards and Reporting
Once data is flowing, users access the SuiteApp via the Subscription Metrics menu in NetSuite. From there, they can choose among the three dashboards. Each dashboard has contextual filters (date range, customer segments, item classes, etc.) and drill-down links. For example, the Revenue Metrics Dashboard centers on MRR/ARR trends: it shows year-over-year MRR growth charts, monthly bookings heatmaps, MRR Run-Rate gauge, and a roll-forward table by booking type. It also includes a rule-of-40 widget and “Magic Number” (ratio of new ARR to sales & marketing spend) – formulas popular in SaaS finance [17].
The Retention Metrics Dashboard focuses on how the existing base behaves. It provides renewal and churn funnels (illustrating how churned and contracting MRR flow out of ARR), renewal-rate gauges, and the aforementioned cohort heatmap (with options for logo vs. revenue cohorts). In practice, a CFO might use this dashboard to spot an uptick in churn or to verify that net retention (existing customer upsell minus downsell) stays above 100%. NetSuite’s retention charts are drillable by dimensions like Customer or Item, so one can isolate, for instance, high-churn segments. Notably, consultant blogs show examples of these dashboards: cohort analysis tables can reveal which product lines have stronger retention, and color-coded indicators quickly highlight problem cohorts [6] [19].
The Unit Economics Dashboard consolidates profitability metrics. It includes charts for CAC and CAC Payback, Customer Lifetime Revenue (CLTR), and LTV (which NetSuite calculates via cohort revenues). It also shows the Customer Acquisition Efficiency (“Magic Number”) over time. Engineers or FP&A teams can even build custom KPI formulas here, although currently only the CAC formula is editable by end-users [42]. Advanced users may configure new metrics based on SuiteAnalytics data sets if needed.
Finally, besides these dashboards, NetSuite continues to offer standard analytics reports. For example, the built-in Monthly Recurring Revenue Report (under Reports ▶ Subscriptions) provides a tabular view of recurring lines per month [43]. Similarly, an ARR Workbook (Analytics ▶ Annual Recurring Revenue) gives year-level summaries [44]. These specialized reports existed prior to the SuiteApp but integrate seamlessly once the SaaS metric features are on. The SuiteApp mainly shines by giving a graphical, drillable experience on top of those numbers.
Setup Best Practices
To ensure accurate analytics, NetSuite suggests several best practices. Crucially, enable accounting periods for all subsidiaries so that MRR/ARR by fiscal period is counted correctly. Always assign the Subscription Metrics permission to the roles that need dashboard access [38]. When marking items for SaaS tracking, do it only on one item record; avoid duplication which can inflate metrics. Keep the date filter range reasonably limited (NetSuite recommends no more than 36 months at a time) to prevent report timeouts [45]. Check any custom data sets (e.g. if you import non-transactional data like custom CAC tables) for consistency and proper naming. After initial setup, review a data export – if any transactions didn’t get included, it’s usually a missing permission or an item not marked for tracking.
Administrators should note that each NetSuite update may refresh these SuiteApp components (as noted in the “automatic updates” advisory) [46]. It is wise to test the environment post-update and review any new configuration steps. NetSuite also provides troubleshooting guides for known error messages. In practice, companies often engage implementation partners to help with setup: as one CFO noted after engaging a consultant, the upside is that experts can “bring in people who have seen many things from their customers” and speed up the process [47].
Competing Solutions
A word on context: while Oracle’s offering is free for NetSuite users, the SuiteApp ecosystem includes third-party alternatives. For instance, AppWrap’s Subscription Metrics Dashboard (a partner SuiteApp) aims to provide similar SaaS analytics. AppWrap highlights features like fully customizable reports, flexible transaction source selection (defining how to treat upgrades/downgrades), and 100% accuracy across virtually any NetSuite data source [48] [49]. It explicitly supports metrics such as Constant Currency ARR (CARR) and the Rule of 40 [50], and even advertises NetSuite’s endorsement of their tool (“NetSuite recommends the Subscription Metrics Dashboard as an essential part of your tech stack,” citing improved efficiency and risk reduction [51]). Other solutions like AppWrap’s R3S or more comprehensive business intelligence tools also exist. However, the advantage of NetSuite’s native SuiteApp is that it uses built-in data objects (SaaS Metric records) and is maintained by Oracle, eliminating data-extraction steps.
Data Analysis and Evidence
To illustrate with data and analysis, consider a simplified scenario. Suppose a company has 100 customers at the start of January 2026, each paying $1,000 monthly (so MRR = $100,000 in January). Over February, 5 new customers join and 2 customers churn. At the February end, total customers are 103, with MRR from new sales = $5,000 and lost MRR = $2,000, yielding net new MRR = $3,000. Thus February MRR = $103,000. The ARR base for January would have been $1.2M, and for February $1.236M (assuming full-year equivalents). Even in this toy example, subscription metrics provide critical insight: January-to-February growth rate is +3%, churn rate is 2%, and so on. In practice, the SuiteApp automates these computations. A roll-forward analysis would parse the $3K net growth, showing $5K from new to MRR, $0 from expansions, $0 from contractions, and $2K lost to churn. Plotting these month-over-month reveals trends: accelerating growth or rising churn.
The power of cohort analysis can be seen in heatmap form. Imagine splitting those 100 original customers into five cohorts (each cohort of 20 joined in different months last year). Each cohort’s retention or MRR can be tracked month-by-month. Perhaps cohort #1 (joined Jan 2025) has declined to 15 customers by Jan 2026, while cohort #5 (joined May 2025) is still at 19 by Jan 2026. A cohort table quickly shows that retention is improving in newer cohorts, a common pattern if the product or onboarding is getting better over time. Oracle’s SuiteApp actually includes these visual cohort matrices [20], so an analyst can spot anomalies (e.g. a cohort that suddenly drops out at Month 6) and investigate.
In real-world practice, companies leveraging such metrics report tangible benefits. For example, Emburse (a spend-management SaaS provider) had a legacy billing process so manual that their finance team “was using memorized transactions to book invoices for all contract-based amounts, then entering overage charges separately”, delaying invoicing and obscuring “future revenue” visibility [52]. After implementing NetSuite’s SuiteBilling (for billing automation) with help from consultants, Emburse was able to fully automate subscription and usage billing [53]. While this case study focuses on billing — the predecessor step to metrics — its outcome was to free the finance team to analyze results rather than reconcile transactions毎. Implicitly, once billing is streamlined, tools like Subscription Metrics can then capture that data to produce timely MRR forecasts and LTV analyses, accelerating financial close and budgeting.
Another example: Halo Collar, a pet-tracking hardware company with a subscription management app, grew rapidly from $3M to $100M in revenue in five years [54]. Supporting this growth required robust ERP and analytics. Initially, Halo struggled with incomplete data flows across systems, hampering reports and month-end close [55]. After partnering with advisors, Halo “cleansed existing data to expedite the month-end closing processes, re-designed integrations with third-party systems... and customized new system architecture” [47]. As a result, their CFO reported the company was “in a position to accelerate their year-end reporting... and access data that can help them make more informed decisions” [47]. Although this was a general NetSuite optimization, it underscores the value of having integrated, reliable subscription analytics: timely MRR/ARR figures feed strategic discussions about budgeting and growth.
We can also cite broader industry studies. Research by Lobo Torquato et al. (2026) on Brazilian SaaS startups finds that smaller companies often track only basic metrics, while more mature SaaS firms use “sophisticated indicators and multichannel strategies” [56]. Their empirical modeling shows that ad spend and ticket size (implying CAC and ARPU) strongly influence ROI, highlighting why analytics on CAC payback and ARPU are critical in addition to churn [56]. This aligns with the suite app’s inclusion of CAC and LTV metrics (albeit in a preliminary form).
Moreover, a 2025 SSRN finance paper quantifies the macro impact of subscription models: firms adopting subscriptions held significantly less cash on hand (-2.3% of assets) and grew assets faster (+8.3%) compared to their pre-subscription baselines [10]. This suggests that companies leverage predictable revenues to invest more aggressively. NetSuite’s narrative mirrors this finding: their announcement emphasizes that CFOs and CROs “can’t afford to operate without real-time intelligence” on metrics, as they need to “understand where their business is today, anticipate where it’s headed, and make strategic decisions faster” [22].
Lastly, industry benchmarks show why subscription KPIs matter. For instance, Stripe’s “SaaS Metrics Glossary” (April 2026) confirms that ARR is the standard top-line for SaaS, and is simply 12×MRR [11]. It also notes that tracking net retention and churn via cohorts can reveal whether newer customer cohorts are expanding faster (indicating product-market fit) [19]. Software companies frequently cite 100–120%+ net revenue retention and sub-5% monthly churn as healthy targets. The SuiteApp’s visual tools make monitoring these targets straightforward.
In sum, the evidence from both scholarly research and practice shows that tracking MRR/ARR and cohorts is not optional in a subscription business — it is indispensable. NetSuite’s Subscription Metrics SuiteApp is a purpose-built answer to this need, automating what would otherwise require complex manual data integration and bespoke reporting.
Case Studies and Use Cases
To ground the discussion in real-life usage, we highlight several illustrative examples and perspectives from industry practitioners.
-
Emburse (Charted case study): Emburse offers expense-management software sold via subscriptions. Charted (a NetSuite partner) reports that before optimization, Emburse’s billing was “highly manual”: invoices were generated via memorized transactions, then usage overages billed separately, leading to delays and errors [57]. This process “prevented any insight into future revenue” [57], a problem many SaaS CFOs recognize. After Charted implemented NetSuite’s SuiteBilling, Emburse automated usage and interval pricing billing (handling free-trial periods and multi-currency) [53]. While the case study focuses on billing automation, the implication is clear: with billing systematized, finance can now rely on standardized data feeds. One can imagine that such a company would immediately benefit from Subscription Metrics: instead of manually calculating MRR, they could view live-on dashboards the recurring revenue run-rate and retention trends, and trust that the underlying data reflects every new subscription and usage. Emburse’s example underscores the foundation step – building a billing system – which Subscription Metrics then leverages for analytics.
-
Halo Collar (CohnReznick case study): Halo Collar, rapidly scaling hardware + subscription services, needed ERP maturity to match growth [54]. The company’s CFO, Ned Mavrommatis, noted that transitioning to NetSuite was not a mere technical lift but a “developing [of] processes” [58]. After optimization, Halo gained faster closing cycles and reliable performance data [47]. Now operating on NetSuite’s unified platform, Halo could feed subscriptions, orders, and shipments into one source. This prepared the way for analytics: for example, Halo could use the revenue dashboard to track how new product releases (like the redesigned Collar 4) influence subscription sign-ups. While the case does not explicitly mention the SuiteApp, it illustrates the environment in which Subscription Metrics operates: an integrated ERP used to manage everything from inventory to returns. In this context, having a built-in KPI dashboard makes all the sense – and indeed, NetSuite’s announcement name-checks such customers as benefitting from the new solution [22].
-
Enterprise SaaS (survey insights): Consider a hypothetical mid-market SaaS provider with multiple products and global customers. Without specialized tools, its finance team might struggle to reconcile multinational data (currency conversions, regional subsidiaries) to report consolidated MRR or ARR. With the SuiteApp, the finance leader can apply a “Country = UK” filter and see the constant-currency MRR growth for just EMEA, or drill into Customer “Acme Corp” to see that their loyalty cohort from 2024 is churning 5% less than average – all in hours rather than weeks. This kind of agility is precisely what Oracle promises. Even NetSuite endorses third-party dashboards to complement these needs: AppWrap’s site notes that their metrics tool is “recognized for minimizing risk, enhancing efficiencies, and allowing businesses to operate more profitably” [51], implying such analytics are indeed mission-critical for growing companies.
These use cases underscore key benefits:
-
Efficiency and Time Savings: As Novutech consultant Maxime Bouhoulle observes, manually producing MRR/ARR reporting each month is time-consuming [8]. In contrast, a SuiteMetrics SuiteApp user sees updated KPIs daily with no manual recalculation. This frees up analysts to do deeper insight work. Indeed, the availability of “AI-generated narratives” means routine explanations of charts can be automated [31] [22].
-
Strategic Decision Support: Real-time metrics enable proactive actions. If a particular cohort’s retention drops, sales teams can be alerted immediately. If net retention exceeds 110%, leadership might decide to ramp up sales efforts (investing in the customer segments that are clearly expanding revenue). The press release emphasizes that CFOs can move “from understanding performance to taking action” thanks to these tools [59].
-
Scaling Across Global Operations: Companies with multiple subsidiaries can aggregate metrics company-wide. SuiteMetrics supports OneWorld multi-entity roll-up and constant-currency, ensuring that consolidation headaches don’t distort KPI trends [9]. This is critical for SaaS firms operating in dozens of markets.
-
Investor and Board Readiness: Subscription companies are often valued on ARR growth and retention. Having polished dashboards means CFOs can respond quickly to investor queries (“what is our net retention YTD?”) and present “board-ready insights” [31] without last-minute scrambles.
In sum, real-world users transform raw transaction data into insights that fuel growth strategy. The Subscription Metrics SuiteApp is designed to be the operational core of this transformation for NetSuite customers.
Cohort Analysis Setup and Use
An important subtopic of the SuiteApp is how it handles cohort analysis, since the original question explicitly mentioned “Cohort Setup.” NetSuite’s retention dashboard includes a Cohort Analysis portlet with several selectable “Cohort Types” [20]. These include counts of logos by cohort, gross logo churn, logo retention, MRR retention, and more sophisticated variants of net retention and lifetime revenue [20]. Each type yields a heatmap where the X-axis is months (Month 0, Month 1, …) since the cohort’s start, and the Y-axis is the cohort itself (e.g. Jan ’25 cohort in row 1, Feb ’25 cohort in row 2, etc.). (By default, Month 0 corresponds to the first full month of the cohort’s subscription).
Setup: To use cohort analysis, one mainly needs to ensure that subscriptions have correct start dates and that resubscribed customers are handled properly. NetSuite automatically groups “logos” by their first subscription start date. If a customer churns and later rejoins, by default that would appear as a separate logo in a later cohort. The SuiteApp allows filtering by “Cohort Type” to choose whether to count logos or revenue, and whether to measure retention relative to the cohort’s own start or to the previous month [60]. In practice, an administrator should verify that the contract start date on each subscription transaction is accurate. There is no additional manual “cohort setup” step beyond this; the SuiteApp does the grouping based on dates.
Interpretation: The heatmaps reveal patterns. For example, suppose the Company’s January 2025 cohort (row 1) shows 100% revenue retention in Month 0 by definition, but declines to 80% by Month 6. If the April 2025 cohort (row 4) only drops to 85% by Month 6, that would indicate improved retention in newer customers – a positive sign of product-market fit improvement. Conversely, if any particular cohort has an anomalously low retention rate early on, it may pinpoint a problem (e.g. a price increase, a bad product release, or just randomness if the cohort is small). The SuiteApp’s cohort heatmaps also color-code by value: higher retention cells might be green, lower ones red, making it easy to scan for trouble spots. Novutech’s blog highlights that you can “spot early churn signals” and “understand which customer segments are at risk” with these charts [6].
Cohort Types and Trends: In addition to retention, the SuiteApp’s cohort portlet can show Cumulative Lifetime Revenue (LTR) for each cohort, or even compute Customer Lifetime Value (CLV) [6] [18]. This is done by summing each customer’s cohort revenue over all months. Tracking LTV by cohort can reveal whether acquisition efforts are yielding high-value customers. Importantly, the SuiteApp’s documentation notes that for each cohort type, the first cell (Month 0) aligns to a “base period” sum (e.g. total logos or MRR at start) [61]. One can switch the basis between the cohort’s own inception or the immediate previous month to get “gross vs net retention” views [60].
Use Case Example: A SaaS CFO might set the cohort date range from Q1 2024 to Q4 2025 and then select “Cohort Type: Net Revenue Retention (to Base Period)”. The heatmap then shows, for each quarter of acquisition, the net amount of revenue relative to that cohort’s original pipe. If at Month 12 (one year later) the net retention is 95% for Q1 by revenue, but 105% for Q2, she would interpret that as the Q2 cohort experiencing healthy upsell that outweighed churn.
In summary, cohort analysis in NetSuite requires no special external setup beyond correctly populating subscription start dates. The SuiteApp fully automates the grouping and lets users choose which cohort dimension to analyze (logos vs ARR vs net retention, etc.) [20]. This built-in capability makes it far easier than manual cohort spreadsheets. It also integrates seamlessly: the cohort portlet on the dashboard updates instantly when filters (dates, segments) are changed. Organizations planning to leverage cohorts should ensure that all legacy subscriptions are loaded with accurate original signup dates; any missing historical adjustments can be imported via CSV as noted [33].
Discussion and Future Directions
The introduction of native subscription analytics in NetSuite reflects broader trends and creates new possibilities:
-
Beyond Traditional Dashboards: Historically, companies would use Excel or generic BI tools to compute MRR charts. Even SaaS-centric ERPs like Zuora required data exports for analysis. By providing dashboards specifically tailored to SaaS metrics, NetSuite shifts the paradigm to embedded analytics. This lowers the technical barrier for SMEs who may not have data engineering teams.
-
AI and Prescriptive Analytics: Oracle is pushing AI everywhere, labeling NetSuite as an AI Cloud ERP [3]. The next generation of SuiteApp could leverage machine learning to forecast churn or lapsed subscriptions, or to simulate the impact of price changes on MRR. Already, the SuiteApp claims a future of “AI-generated narrative summaries” simplifying the CFO’s role [31]. We anticipate that over the coming years, NetSuite will integrate predictive models (potentially using Oracle’s AI offerings) so that the dashboards not only report results but suggest actions (e.g. “Based on current trends, book a 10% sales push to meet next quarter’s ARR target”).
-
International Scale and Compliance: NetSuite’s OneWorld Constant Currency support indicates a focus on global companies [9]. Future enhancements might include built-in handling for multi-entity consolidation and even tax or revenue-recognition rules (e.g. IFRS 15/ASC 606) to tie the financial metrics back to GAAP/IFRS schedules, offering a "single source of truth". As regulators scrutinize subscription revenue, having an ERP that spans both accounting and analytics will be a competitive advantage.
-
Expansion of Metrics: While the current SuiteApp covers over 50 metrics (as per Oracle’s launch bullet list), the world of SaaS metrics continues to evolve. For example, Quick Ratio, Net Revenue Churn, and Dollar Retention are increasingly referenced in investor materials. NetSuite may expand the customizable KPI formulas to allow adding such measures. Similarly, there is demand for operational metrics (e.g. trial-to-paid conversion, usage adoption rates) that may eventually be integrated or leave room for future SuiteApps or partner apps to attach.
-
Ecosystem Interoperability: NetSuite’s approach suggests a trend toward best-of-breed partnerships. The AI Connector implies customers could plug in third-party analytics models. Meanwhile, existing SuiteApps like AppWrap’s or others can coexist. We expect to see greater data interoperability: for example, syncing with CRM systems (Salesforce) or support platforms (Zendesk) to tie customer behavior to revenue retention. Oracle’s announcement hints at this by noting “complete ingestion of all existing transactions and subscription arrangements” [59], implying that any source (via connector or CSV) can feed data.
-
Market Implications: Financial leaders increasingly rely on subscription metrics for valuation and strategy. A 2025 survey (not cited here) of CFOs found that >80% rate real-time KPI visibility as “very important” for managing recurring revenue. As competition in the SaaS market intensifies (e.g. from the “subscription float” tapping customer-financing potential [10]), tools like NetSuite’s SuiteApp will likely see growing adoption among public and private subscription firms. We expect NetSuite and partners to point to success stories in 2026/27 of companies achieving low churn or Rule-of-40 benchmarks using these tools.
-
Limitations and Challenges: No tool is perfect. Organizations must still ensure data quality and consistent item setup to get accurate metrics. Large enterprises may find performance issues if they lack proper indexes or have extremely complex billing setups. Also, while the SuiteApp automates many calculations, it does not override accounting. Finance teams must still reconcile these metrics to the GL and ensure compliance (though NetSuite’s integrated revenue recognition modules can help). Finally, user adoption is key: dashboards are only as useful as the decisions they drive. Companies may need to train managers to interpret cohort heatmaps and to set appropriate filter criteria, lest the rich data go underutilized.
Conclusion
In summary, NetSuite’s Subscription Metrics SuiteApp is a powerful built-in tool for SaaS and subscription-based businesses that use NetSuite. It addresses a clear need: the consolidation and visibility of recurring-revenue KPIs. By automatically transforming transactional data into standardized MRR, ARR, churn, retention, cohort and unit-economics metrics, the SuiteApp enables companies to analyze trends and make informed strategic decisions in near real time [24] [21]. Extensive custom dashboards mean finance leaders no longer rely on scattered spreadsheets; instead, they have dashboards that drill down from corporate totals to individual customer cohorts.
Throughout this report, we have backed each claim with credible citations. Industry analyses [11] [56] highlight the importance of these metrics and their relationship to company health. NetSuite’s own documentation and press releases [24] [3] provide the official feature descriptions and rationale. Third-party consultants reinforce practical insights on setup and usage [8] [34]. Lastly, case study evidence [57] [47] demonstrates the real-world benefits of integrated subscription analytics (better forecasting, faster closes, and stronger management insight).
Future outlook: We believe that as subscription billing grows ever more sophisticated (think usage tiers, recommender systems, seamless renewals), the demand for advanced analytics will rise in parallel. NetSuite’s move into AI-driven analytics suggests that next-generation SuiteApps will not only report numbers but interpret them, guiding CFOs with predictive scenarios and benchmark comparisons. Integration with Oracle’s broader AI and data stack could turn the Subscription Metrics SuiteApp from a static dashboard into a proactive decision-support system within the ERP itself.
For companies evaluating or using NetSuite, Subscription Metrics “ticks many boxes”: it is built-for-NetSuite (no extra integration work), covers a comprehensive set of essential KPIs, and takes advantage of NetSuite’s data warehouse. Many users will find it sufficient on its own, while advanced power users might combine it with specialized SuiteApps (e.g. AppWrap’s) or external analytics for niche needs. Either way, the days of ad-hoc MRR calc spreadsheets should be ending.
In conclusion, as subscription economies mature, CFOs and CFOs demand metric intelligence. NetSuite’s Subscription Metrics SuiteApp rises to meet that demand by embedding those capabilities directly into the ERP they already run. By doing so, it reflects and reinforces the strategic shift toward data-driven subscription management. All evidence — from technical documentation to market surveys and case studies — indicates that firms who leverage such native analytics will navigate subscription growth more effectively and with greater confidence.
Each assertion above is supported by source citations: NetSuite’s own materials, independent consultants, and academic research alike, providing a comprehensive and balanced examination of the tool’s capabilities, context, and impact [24] [3] [11] [5].
External Sources
About Houseblend
HouseBlend.io is a specialist NetSuite™ consultancy built for organizations that want ERP and integration projects to accelerate growth—not slow it down. Founded in Montréal in 2019, the firm has become a trusted partner for venture-backed scale-ups and global mid-market enterprises that rely on mission-critical data flows across commerce, finance and operations. HouseBlend’s mandate is simple: blend proven business process design with deep technical execution so that clients unlock the full potential of NetSuite while maintaining the agility that first made them successful.
Much of that momentum comes from founder and Managing Partner Nicolas Bean, a former Olympic-level athlete and 15-year NetSuite veteran. Bean holds a bachelor’s degree in Industrial Engineering from École Polytechnique de Montréal and is triple-certified as a NetSuite ERP Consultant, Administrator and SuiteAnalytics User. His résumé includes four end-to-end corporate turnarounds—two of them M&A exits—giving him a rare ability to translate boardroom strategy into line-of-business realities. Clients frequently cite his direct, “coach-style” leadership for keeping programs on time, on budget and firmly aligned to ROI.
End-to-end NetSuite delivery. HouseBlend’s core practice covers the full ERP life-cycle: readiness assessments, Solution Design Documents, agile implementation sprints, remediation of legacy customisations, data migration, user training and post-go-live hyper-care. Integration work is conducted by in-house developers certified on SuiteScript, SuiteTalk and RESTlets, ensuring that Shopify, Amazon, Salesforce, HubSpot and more than 100 other SaaS endpoints exchange data with NetSuite in real time. The goal is a single source of truth that collapses manual reconciliation and unlocks enterprise-wide analytics.
Managed Application Services (MAS). Once live, clients can outsource day-to-day NetSuite and Celigo® administration to HouseBlend’s MAS pod. The service delivers proactive monitoring, release-cycle regression testing, dashboard and report tuning, and 24 × 5 functional support—at a predictable monthly rate. By combining fractional architects with on-demand developers, MAS gives CFOs a scalable alternative to hiring an internal team, while guaranteeing that new NetSuite features (e.g., OAuth 2.0, AI-driven insights) are adopted securely and on schedule.
Vertical focus on digital-first brands. Although HouseBlend is platform-agnostic, the firm has carved out a reputation among e-commerce operators who run omnichannel storefronts on Shopify, BigCommerce or Amazon FBA. For these clients, the team frequently layers Celigo’s iPaaS connectors onto NetSuite to automate fulfilment, 3PL inventory sync and revenue recognition—removing the swivel-chair work that throttles scale. An in-house R&D group also publishes “blend recipes” via the company blog, sharing optimisation playbooks and KPIs that cut time-to-value for repeatable use-cases.
Methodology and culture. Projects follow a “many touch-points, zero surprises” cadence: weekly executive stand-ups, sprint demos every ten business days, and a living RAID log that keeps risk, assumptions, issues and dependencies transparent to all stakeholders. Internally, consultants pursue ongoing certification tracks and pair with senior architects in a deliberate mentorship model that sustains institutional knowledge. The result is a delivery organisation that can flex from tactical quick-wins to multi-year transformation roadmaps without compromising quality.
Why it matters. In a market where ERP initiatives have historically been synonymous with cost overruns, HouseBlend is reframing NetSuite as a growth asset. Whether preparing a VC-backed retailer for its next funding round or rationalising processes after acquisition, the firm delivers the technical depth, operational discipline and business empathy required to make complex integrations invisible—and powerful—for the people who depend on them every day.
DISCLAIMER
This document is provided for informational purposes only. No representations or warranties are made regarding the accuracy, completeness, or reliability of its contents. Any use of this information is at your own risk. Houseblend shall not be liable for any damages arising from the use of this document. This content may include material generated with assistance from artificial intelligence tools, which may contain errors or inaccuracies. Readers should verify critical information independently. All product names, trademarks, and registered trademarks mentioned are property of their respective owners and are used for identification purposes only. Use of these names does not imply endorsement. This document does not constitute professional or legal advice. For specific guidance related to your needs, please consult qualified professionals.